Cost Of Solar Panels By State: Average Prices Per Watt (2026)
Published April 15, 2026
Solar installation costs range from $2.50/W in Arizona and Texas to $3.20/W in DC and Hawaii. The federal residential credit (IRC §25D) expired Dec 31, 2025 — a system you own and install in 2026 gets $0 federal, so a typical 5 kW residential system costs its gross $12,500–$16,000 depending on your state. A lease/PPA can still use the commercial §48E credit, which the provider claims and may pass through as a lower rate. But installed cost alone does not determine value — your electricity rate and sun exposure matter just as much. Hawaii's high installation cost ($3.10/W) delivers the fastest payback in the country (4–5 years) because electricity costs $0.35/kWh. Meanwhile, cheap-to-install Texas ($2.50/W) has slower payback (10–11 years) because electricity is only $0.13/kWh. This guide covers every state.
- • Net billing (NEM 3.0)
- • SGIP battery rebate
- • DAC-SASH low-income program
- • Property tax exclusion
Why Solar Costs Vary by State
Five factors drive the state-by-state price differences:
Labor rates. Installation labor is the single largest variable cost component, representing 15–25% of the total system price. States with higher prevailing wages (New York, California, Massachusetts, Connecticut) pass those costs through. In Texas and Arizona, lower labor costs translate directly to lower $/W pricing.
Permitting complexity. Some states and municipalities have streamlined solar permitting to a simple online application processed in days. Others require structural engineering reviews, multiple inspections, utility interconnection studies, and weeks of processing time. Every hour of administrative work adds to the installer's cost — and your price.
Market competition. States with mature solar markets (California, Texas, Arizona, Florida) have dozens of competing installers. Competition compresses margins and drives prices toward the floor. In states with fewer installers, less competition means higher margins.
Sales tax treatment. Some states fully exempt solar equipment from sales tax (Arizona, New Jersey, New York, Massachusetts, and others). In states that charge sales tax on solar, it adds 4–8% to the equipment cost.
Logistics and geography. Hawaii faces shipping surcharges on all equipment. Alaska has extreme logistics costs and a short installation season. Even within the continental US, rural areas in any state tend to cost more due to longer installer travel times.
All 50 States: Solar Cost, Rate, and Payback
Solar production varies dramatically by location. The NREL irradiance map below shows why — the Southwest receives nearly twice the annual sunlight as the Pacific Northwest. This directly affects payback periods.
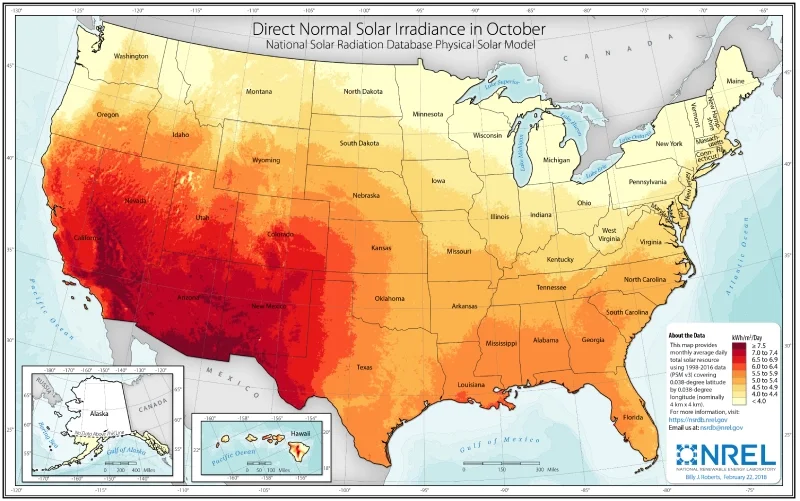
The table below shows installed cost per watt, the gross cost of a 5 kW system (the federal §25D residential credit expired Dec 31, 2025, so an owned 2026 system gets $0 federal and its net cost equals the gross), the average residential electricity rate, and an estimated payback period. Payback estimates use each state's average peak sun hours with a 0.83 PVWatts derate factor, computed on the full gross owned cost with $0 federal credit (2026). Paybacks are shown only for states with a firm sun-and-rate anchor; a dash means the estimate is not re-derived here.
| State | $/W | 5 kW Gross Cost | 5 kW Owned Net (2026) | Elec. Rate ($/kWh) | Est. Payback (years) |
|---|---|---|---|---|---|
| Alabama | $2.70 | $13,500 | $13,500 | $0.14 | — |
| Alaska | $3.00 | $15,000 | $15,000 | $0.23 | — |
| Arizona | $2.50 | $12,500 | $12,500 | $0.14 | ~10 |
| Arkansas | $2.70 | $13,500 | $13,500 | $0.11 | — |
| California | $3.00 | $15,000 | $15,000 | $0.25 | ~5 |
| Colorado | $2.80 | $14,000 | $14,000 | $0.15 | — |
| Connecticut | $3.10 | $15,500 | $15,500 | $0.26 | — |
| Delaware | $2.80 | $14,000 | $14,000 | $0.14 | — |
| DC | $3.20 | $16,000 | $16,000 | $0.14 | — |
| Florida | $2.60 | $13,000 | $13,000 | $0.14 | ~12 |
| Georgia | $2.70 | $13,500 | $13,500 | $0.13 | — |
| Hawaii | $3.10 | $15,500 | $15,500 | $0.35 | ~4 |
| Idaho | $2.80 | $14,000 | $14,000 | $0.10 | — |
| Illinois | $2.90 | $14,500 | $14,500 | $0.16 | — |
| Indiana | $2.80 | $14,000 | $14,000 | $0.14 | — |
| Iowa | $2.80 | $14,000 | $14,000 | $0.14 | — |
| Kansas | $2.70 | $13,500 | $13,500 | $0.14 | — |
| Kentucky | $2.70 | $13,500 | $13,500 | $0.12 | — |
| Louisiana | $2.70 | $13,500 | $13,500 | $0.10 | — |
| Maine | $2.90 | $14,500 | $14,500 | $0.22 | — |
| Maryland | $2.90 | $14,500 | $14,500 | $0.16 | — |
| Massachusetts | $3.10 | $15,500 | $15,500 | $0.28 | ~7 |
| Michigan | $2.80 | $14,000 | $14,000 | $0.18 | — |
| Minnesota | $2.80 | $14,000 | $14,000 | $0.14 | — |
| Mississippi | $2.70 | $13,500 | $13,500 | $0.12 | — |
| Missouri | $2.70 | $13,500 | $13,500 | $0.13 | — |
| Montana | $2.80 | $14,000 | $14,000 | $0.12 | — |
| Nebraska | $2.80 | $14,000 | $14,000 | $0.12 | — |
| Nevada | $2.60 | $13,000 | $13,000 | $0.13 | — |
| New Hampshire | $3.00 | $15,000 | $15,000 | $0.23 | — |
| New Jersey | $2.90 | $14,500 | $14,500 | $0.18 | — |
| New Mexico | $2.60 | $13,000 | $13,000 | $0.14 | — |
| New York | $3.10 | $15,500 | $15,500 | $0.24 | ~10 |
| North Carolina | $2.70 | $13,500 | $13,500 | $0.13 | — |
| North Dakota | $2.80 | $14,000 | $14,000 | $0.12 | — |
| Ohio | $2.80 | $14,000 | $14,000 | $0.15 | — |
| Oklahoma | $2.60 | $13,000 | $13,000 | $0.12 | — |
| Oregon | $2.80 | $14,000 | $14,000 | $0.13 | — |
| Pennsylvania | $2.90 | $14,500 | $14,500 | $0.17 | — |
| Rhode Island | $3.00 | $15,000 | $15,000 | $0.24 | — |
| South Carolina | $2.70 | $13,500 | $13,500 | $0.14 | — |
| South Dakota | $2.70 | $13,500 | $13,500 | $0.13 | — |
| Tennessee | $2.70 | $13,500 | $13,500 | $0.12 | — |
| Texas | $2.50 | $12,500 | $12,500 | $0.13 | ~11 |
| Utah | $2.60 | $13,000 | $13,000 | $0.11 | — |
| Vermont | $3.00 | $15,000 | $15,000 | $0.21 | — |
| Virginia | $2.80 | $14,000 | $14,000 | $0.14 | — |
| Washington | $2.80 | $14,000 | $14,000 | $0.11 | ~19 |
| West Virginia | $2.80 | $14,000 | $14,000 | $0.13 | — |
| Wisconsin | $2.80 | $14,000 | $14,000 | $0.16 | — |
| Wyoming | $2.80 | $14,000 | $14,000 | $0.12 | — |
Data sources: NREL Q1 2024 cost benchmarks, EIA 2024 average residential rates, PVWatts v8 production estimates with 0.83 derate factor.
10 Cheapest States for Solar Installation
These states offer the lowest per-watt installed costs, driven by installer competition, favorable permitting, and lower labor costs:
| Rank | State | $/W | 5 kW Gross Cost | Key Factor |
|---|---|---|---|---|
| 1 | Arizona | $2.50 | $12,500 | Huge market, simple permits |
| 2 | Texas | $2.50 | $12,500 | High competition, no income tax (but no state credit) |
| 3 | Florida | $2.60 | $13,000 | Large market, sales tax exempt |
| 4 | Nevada | $2.60 | $13,000 | Strong solar market, NV Energy incentives |
| 5 | New Mexico | $2.60 | $13,000 | Good sun, growing market |
| 6 | Oklahoma | $2.60 | $13,000 | Low labor costs |
| 7 | Utah | $2.60 | $13,000 | Competitive market, tax credit |
| 8 | Alabama | $2.70 | $13,500 | Low labor costs |
| 9 | Arkansas | $2.70 | $13,500 | Low labor costs |
| 10 | Georgia | $2.70 | $13,500 | Growing market, moderate labor |
Note that cheapest installation does not always mean best value. On the full gross cost with $0 federal credit (2026), Arizona at $2.50/W with $0.14/kWh electricity has roughly an 11-year payback, while low-rate states like Arkansas at $2.70/W with $0.11/kWh electricity run well beyond 15 years.
10 Most Expensive States for Solar Installation
Higher costs in these states are driven by complex permitting, high labor rates, and in some cases, limited installer competition:
| Rank | State | $/W | 5 kW Gross Cost | Why It's Expensive |
|---|---|---|---|---|
| 1 | DC | $3.20 | $16,000 | High labor, complex urban permitting |
| 2 | Connecticut | $3.10 | $15,500 | High labor, regulatory overhead |
| 3 | Hawaii | $3.10 | $15,500 | Equipment shipping, island logistics |
| 4 | Massachusetts | $3.10 | $15,500 | High labor, complex permitting |
| 5 | New York | $3.10 | $15,500 | High labor, varied local permits |
| 6 | Alaska | $3.00 | $15,000 | Remote logistics, short season |
| 7 | California | $3.00 | $15,000 | High labor, NEM 3.0 complexity |
| 8 | New Hampshire | $3.00 | $15,000 | Small market, high labor |
| 9 | Rhode Island | $3.00 | $15,000 | Small market, high labor |
| 10 | Vermont | $3.00 | $15,000 | Small market, rural logistics |
Despite higher installation costs, many of these states deliver the best payback because electricity rates are also high. On the full gross cost with $0 federal credit (2026), Massachusetts at $3.10/W but $0.28/kWh achieves roughly a 7-year payback — still faster than Texas at $2.50/W but $0.13/kWh (~12-year payback).
States with the Best Incentives
The federal residential credit (IRC §25D) expired Dec 31, 2025, so owned 2026 systems get $0 federal (a lease/PPA can still use the commercial §48E credit, claimed by the provider). These state programs remain and add significant extra value:
New York — NY-Sun Program
Residential rebates up to $0.20/W through NYSERDA. For a 5 kW system, that is up to $1,000 (the federal §25D credit it used to stack on expired Dec 31, 2025 for owned systems). Combined with high electricity rates ($0.24/kWh), New York is still one of the better states for solar ROI despite above-average installation costs.
Massachusetts — SMART Program
The Solar Massachusetts Renewable Target program pays performance-based incentives of $0.03–$0.06 per kWh produced over 10 years. For a 5 kW system producing 6,500 kWh/year, that adds $195–$390/year in additional income on top of electricity savings.
New Jersey — TRECs
Transition Renewable Energy Certificates are earned for every MWh of solar production and can be sold for $0.04–$0.06/kWh. A 5 kW system generating 6,800 kWh/year earns $272–$408/year in TREC income.
Illinois — SRECs
Illinois Solar Renewable Energy Credits are worth $60–$80 each (1 per MWh produced). A 5 kW system producing 6,500 kWh/year earns 6.5 SRECs annually, worth $390–$520.
Connecticut — RSIP
The Residential Solar Investment Program provides performance-based incentives that vary by utility territory. The program has been one of the most successful state solar programs in the US.
Maryland — State Tax Credit
Maryland offers a state income tax credit of up to $1,000 for residential solar installations. The federal §25D credit it used to stack with expired Dec 31, 2025, so owned 2026 systems get $0 federal.
California — NEM 3.0
While not a rebate, California's net metering policy (NEM 3.0, effective April 2023) still provides value for solar production, though at reduced export rates compared to the previous NEM 2.0 program. The extremely high electricity rate ($0.25/kWh) means solar still pencils out well, especially when paired with battery storage.
How to Evaluate Solar Value in Your State
The installed cost per watt is just one variable. To determine whether solar is a good investment in your state, evaluate all three factors together:
1. Net cost after all incentives
Start with the installed cost. The 30% federal §25D credit expired Dec 31, 2025, so an owned 2026 system subtracts $0 federal (a lease/PPA can still use the commercial §48E credit, claimed by the provider). Then subtract any state rebates, tax credits, or SRECs. This is your true out-of-pocket cost.
2. Annual production value
Multiply your expected annual production (use PVWatts for your specific address) by your electricity rate. If your state has SRECs or performance incentives, add that income.
3. Simple payback
Divide net cost by annual production value. Under 8 years is excellent. 8–12 years is good. Over 12 years means the financial case is weaker (though still positive over the 25-year panel life).
Example — Massachusetts vs. Texas:
| Factor | Massachusetts | Texas |
|---|---|---|
| Installed cost (5 kW) | $15,500 | $12,500 |
| Federal credit (§25D, expired 12/31/2025) | $0 | $0 |
| State incentives | -$1,500 (SMART est.) | $0 |
| Net cost | $14,000 | $12,500 |
| Annual production | 6,500 kWh | 7,863 kWh |
| Electricity rate | $0.28/kWh | $0.13/kWh |
| Annual savings | $1,820 | $1,022 |
| SMART income | $325/year | $0 |
| Total annual value | $2,145 | $1,022 |
| Payback | ~7 years | ~12 years |
Massachusetts costs more to install but delivers almost twice the annual value, resulting in a payback period well under that of Texas. This is why installed cost alone is a misleading metric.
How to Get the Best Solar Quote in Your State
Use comparison platforms. EnergySage, SolarReviews, and similar platforms let you compare multiple installer quotes side by side. Always get at least three quotes before committing.
Compare on a $/W basis. This normalizes across system sizes and makes quotes directly comparable. Ask each installer for the total installed cost divided by the system's DC wattage.
Check installer credentials. Look for NABCEP-certified installers, verify their state contractor's license, and check reviews on Google and the Better Business Bureau. A slightly higher price from a reputable installer is usually worth it for warranty support.
Understand the equipment. Not all $2.80/W quotes are equal. Compare panel brand and warranty (25 vs. 30 years), inverter type (string vs. microinverter), and what is included in the monitoring package.
Ask about financing. Many installers offer $0-down solar loans at 4–7% APR. Compare the total cost of financing (principal + interest over the loan term) to the total electricity savings over the same period. In high-rate states with faster payback, the monthly loan payment can be close to or below the electricity savings; elsewhere it typically runs somewhat higher at first.
Verify net metering terms. Before signing, confirm your utility's net metering policy. The installer should handle the interconnection application, but you should understand the terms — particularly the credit rate for exported power and any caps on system size.
Keep Reading
Frequently Asked Questions
What is the average cost of solar panels per watt in 2026?
Which state has the cheapest solar installation?
Which state has the most expensive solar installation?
Which state has the best solar payback period?
Does the federal solar tax credit vary by state?
Which states have the best solar incentives beyond the federal credit?
Why does solar cost more in some states than others?
Is solar worth it in states with cheap electricity?
Sources
- NREL — U.S. Solar Photovoltaic System And Energy Storage Cost Benchmark Q1 2024
- EIA — Average Retail Electricity Prices By State (2024)
- IRS — Section 25D Residential Clean Energy Credit
- DSIRE — Database Of State Incentives For Renewables And Efficiency
- EnergySage — Solar Marketplace Data: Median Installed Cost (Q4 2024)
- NREL PVWatts Calculator (Version 8)
- LBNL — Tracking The Sun 2024: Pricing And Design Trends For Distributed PV