Peak Sun Hours Calculator
Find the peak sun hours per day at your exact U.S. location using NREL PVWatts v8 and the National Solar Radiation Database. Free, no signup, government data. For Europe see PVGIS; for the rest of the world see Global Solar Atlas.
Find peak sun hours at your location
Powered by NREL PVWatts v8 and the National Solar Radiation Database. Free, no signup, U.S. only.
Your coordinates are used only for the lookup. We do not store them.
What Are Peak Sun Hours?
Peak sun hours (PSH) is the equivalent number of hours per day during which solar irradiance averages 1,000 W/m² — the same reference intensity used to rate solar panels at Standard Test Conditions. It is the single most important number for sizing a solar system, because it converts instantaneous panel wattage into daily kilowatt-hours of energy.
A location with 5 peak sun hours per day does not have 5 hours of sunshine. It receives a total daily solar energy that is equivalent to 5 hours at full noon-sun intensity. The actual irradiance curve looks like a smooth bell from sunrise to sunset — PSH just integrates the area under that curve and normalizes it to the standard 1,000 W/m² reference, giving you a single clean number to multiply by.
The formula every solar calculator uses:
Where derate is the system loss factor — typically 0.77 for a residential rooftop, per NREL PVWatts defaults. So a 5 kW system in a location with 5 PSH/day produces 5 × 5 × 0.77 ≈ 19.25 kWh/day, or about 7,026 kWh/year.
How This Calculator Works
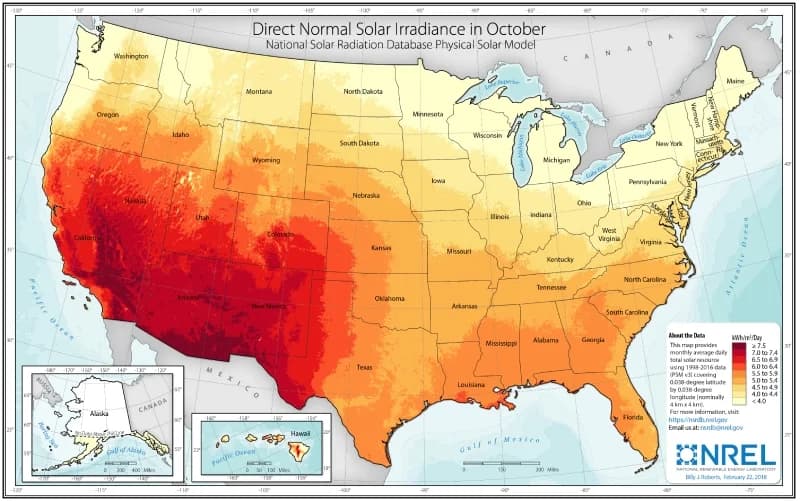
The peak sun hours numbers shown above come directly from the NREL PVWatts v8 API, which is the U.S. Department of Energy's official solar production model. PVWatts pulls its irradiance data from the National Solar Radiation Database (NSRDB), a NASA / DOE / NREL collaboration that has been collecting and modeling solar irradiance for the entire United States since 1991.
For each lookup, this tool calls PVWatts with these standardized parameters (the same ones used to generate the data on all 51 of our state pages):
- Location: your exact lat/lon (resolved to nearest NSRDB 4 km grid cell)
- System capacity: 1 kW (so the result scales linearly with any system size)
- Module type: Standard monocrystalline silicon
- Array type: Fixed roof mount
- Tilt: 20° (typical residential)
- Azimuth: 180° (south-facing)
- System losses: 14% (PVWatts default — covers inverter, wiring, soiling, mismatch)
The NSRDB combines geostationary satellite imagery (GOES-East and GOES-West for the contiguous U.S., Himawari-8 for Hawaii and the Pacific), surface ground-truth measurements from a network of pyranometers, and atmospheric models for cloud cover, aerosols, and water vapor. The result is hourly irradiance data on a 4 km × 4 km grid covering the entire United States, validated against decades of measurements.
This is the same dataset every U.S. solar installer uses for production estimates — there is no more authoritative source for U.S. peak sun hours. The methodology is documented in NREL/TP-7A40-78803, the PVWatts v8 Methodology Manual.
Peak Sun Hours By State (Top And Bottom 10)
For reference, here are the U.S. extremes. The full table for all 51 states (plus DC) is at average peak sun hours by state. The U.S. average is 4.98 PSH/day.
| # | State | PSH/day |
|---|---|---|
| 1 | Arizona | 6.54 |
| 2 | New Mexico | 6.42 |
| 3 | Nevada | 6.41 |
| 4 | California | 6.08 |
| 5 | Hawaii | 5.82 |
| 6 | Colorado | 5.66 |
| 7 | Oklahoma | 5.50 |
| 8 | Florida | 5.48 |
| 9 | Kansas | 5.39 |
| 10 | Utah | 5.39 |
| # | State | PSH/day |
|---|---|---|
| 42 | Ohio | 4.54 |
| 43 | Connecticut | 4.53 |
| 44 | Illinois | 4.51 |
| 45 | New York | 4.50 |
| 46 | Michigan | 4.47 |
| 47 | North Dakota | 4.45 |
| 48 | Vermont | 4.36 |
| 49 | Oregon | 4.06 |
| 50 | Washington | 3.95 |
| 51 | Alaska | 3.17 |
Peak Sun Hours vs. Daylight Hours
These two get conflated constantly, but they are different things. Daylight hours measure how long the sun is above the horizon — anywhere from 8 hours (winter solstice in Maine) to 16 hours (summer solstice in Maine). Daylight is what your eyes experience.
Peak sun hours measure usable solar energy, normalized to the 1,000 W/m² reference. Most of the day, the sun is at less than full intensity — early morning and late afternoon irradiance can be only 200–400 W/m² because the sun is low and its rays are passing through more atmosphere. PSH is the integrated total.
On a clear summer day in Phoenix, you might get 14 hours of daylight but only 7.5 peak sun hours. On a cloudy winter day in Seattle, you might get 9 hours of daylight but only 1.2 peak sun hours. Solar panels care about the second number, not the first.
Why Your Number Differs From The State Average
The state-level numbers most articles quote are calculated from a single representative city per state — usually the largest population center or the state capital. That works fine for flat states with one climate zone, but fails badly for states with strong elevation gradients or coastal microclimates.
A few examples where the state number is misleading:
- California: The state PSH is 6.08, based on inland Sacramento. Coastal San Francisco gets ~5.3, while inland Bakersfield exceeds 6.6. A 25% spread within one state.
- Colorado: Denver at 5.66, but the western Grand Junction valley gets ~6.0 and the high mountain valleys near Leadville exceed that — clear skies plus thin atmosphere from 10,000 ft elevation.
- Washington: Seattle is 3.95, but Eastern Washington (Spokane, Yakima) gets 5.0+. The Cascades create two completely different solar climates inside one state.
- Hawaii: Honolulu is 5.82, but the leeward (dry) sides of all the islands get 6.5+ while the windward (wet) sides drop below 5.0.
This is exactly why the NSRDB grid resolution matters. A 4 km grid cell is fine enough to capture all of these microclimates. The state-level number is a starting point; the address-level number is the answer.
Sources
- [1] NREL — PVWatts v8 Calculator (the underlying API used by this tool)
- [2] NREL — National Solar Radiation Database (NSRDB)
- [3] NREL — PVWatts v8 Methodology Manual (NREL/TP-7A40-78803)
- [4] Lawrence Berkeley National Laboratory — Tracking the Sun (PV system data)
- [5] DOE Solar Energy Technologies Office — Solar Photovoltaic Cell Basics
- [6] EIA — How much electricity does an American home use? (avg 10,791 kWh/yr)
- [7] European Commission JRC — PVGIS (international equivalent of PVWatts)